
Dashboard Software: Will DIY Make BI Tools Obsolete?

Can you replace Google's dashboard software Looker with a bunch of HTML files? That is what data engineer David Lequin asked. It sounds like blasphemy, because in the past you had to pay a lot of programmers to build something like this. That is exactly the heretical question. This article shows what his DIY build cost, what Power BI, Looker and Tableau do in response, and what you really need for your own dashboard.
Dashboard software does not become obsolete. But the part many people pay the licence for, building dashboards, is getting cheap with AI. In the case discussed here, a single dashboard costs around 50 cents in AI tokens. Everything underneath stays expensive: clean data, one consistent definition of every key figure, permissions and security. If you already have that, you can build the interface yourself. If you still have to build it, you save a lot less.
What is dashboard software, and what are BI tools?
A dashboard shows the most important figures at a glance, usually as charts and KPIs. Dashboard software is the program you use to build such views, connect them to data and share them with your team. In companies these programs are usually called BI tools, short for business intelligence. The best known are Microsoft's Power BI, Salesforce's Tableau and Google's Looker.
One mix-up happens often: Looker Studio, formerly Google Data Studio, is the free tool for reports from Google Analytics or Google Ads. Looker is the enterprise platform with its own data model, and that is the one this article is about.
Looker for $150,000 vs a bunch of HTML files
David Lequin works in a team of three data engineers at a company of around 500 people. He does not reveal what his company pays for Looker. He works with the average: around $150,000 a year for about 300 seats. The procurement service Vendr worked out this figure from 355 Looker contracts.1
It started small. Claude spat out finished HTML pages with charts in response to questions, and they often looked better than the Looker dashboards. They just sat in the downloads folder. One colleague spent an afternoon building a small service that stores the files behind the company login. In March an interface was added through which every dashboard queries live data, using the permissions of the person currently viewing it. If you are not allowed to read the sales table in the database, you do not see it in the dashboard either.1 After eight months the self-built tool has about as many users per week as Looker, and Looker usage has fallen by a third.1
Looker vs DIY: 4 figures
February to October 2026, a company of around 500 people
- $8,300 DIY build$6,400 for Claude, $1,900 for AWS. Not counting the team's working time.
- ≈ $100,000 LookerEight months at the average price of $150,000 a year.
- 23 to 136 usersWeekly viewers from March to June 2026.
- ≈ $0.50 per dashboardTokens for the AI agent, from the question to the finished page.
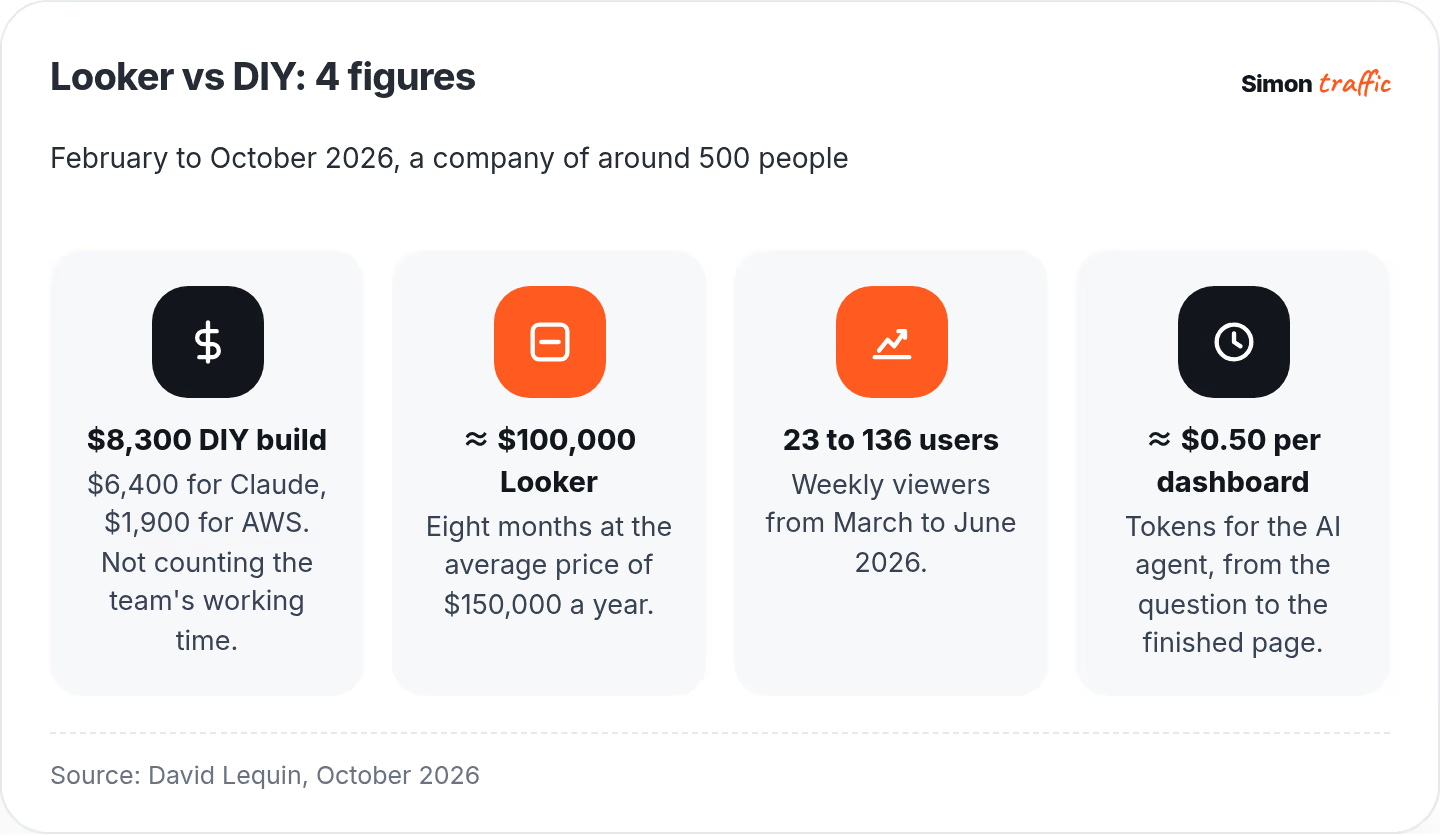
The balance after eight months
From February to October 2026 the DIY build cost the company $8,300: $6,400 for Claude tokens and $1,900 for AWS. Looker would have cost around $100,000 over the same period. For running it, Lequin now expects around $20,000 a year, most of it for new features.1
Two things belong with this, though, and Lequin says them himself. The working time of the three engineers is not included, because they did this alongside their normal work. And Looker has not been fully replaced yet. Some teams still work with it, and for some dashboards there is no replacement yet.1
Security was bad at the start
Lequin is open about this too: in the first months, every dashboard could run code on behalf of the person opening it, and anyone in the company could read any dashboard. Only after that did the team build the security model properly. Today every dashboard runs sandboxed, without access to credentials, and a separate service checks every new version. According to Lequin, almost all of the thinking went into exactly this part.1
What Power BI, Looker and Tableau are doing with AI
Power BI, Looker and Tableau are not abolishing the dashboard. They are adding AI, mostly as a chat. Copilot in Power BI, for example, can create report pages from a description, summarise the data model and write queries.2 Gartner expects that by 2027, three quarters of new analytics content will be prepared with generative AI for intelligent applications.3
On 8 October 2026 Anthropic launched Claude Dashboards as a beta. In response to a question in plain language, Claude writes a database query for each chart and builds a dashboard from them. Anthropic itself describes it as a tool for quick, exploratory questions.4 Lequin writes that if you have no BI tool at all today, you should probably look at this first.1
But my point is not about adding AI to the software. The real question is whether you can replace it completely with your own web apps.
How a DIY dashboard works
For this you do not need AI agents in the dashboard, just APIs. The AI helps with building, not with displaying. A simple example: say you are measuring clicks.
- Collect data: Every click ends up in a database.
- Prepare data: A program cleans the raw data and calculates the key figures, such as clicks per day.
- Output data: The same program serves the figures via an API.
- Show data: An HTML page fetches the figures and draws a line chart from them.
The AI writes the HTML page and the small program behind it for you in minutes. The whole thing has to run on a server that you operate or rent yourself. You can find more on this in the glossary under self-hosting. Sekou Tyler shows how fast this can go: by his own account, he rebuilt a Tableau dashboard with Claude and the MotherDuck service in under an hour, without writing a line of code himself.5

What you notice at the moment: you scroll through deserts of text and numbers. But in the end it is about the charts and the story behind them. And third-party software is just code too. The reason companies do not simply swap it out is more that it has become part of the routine.
What you still need for your own dashboard
The interface has become cheap with AI. What it stands on has not.
Clean data
APIs alone are not enough. The data has to be cleaned and prepared with formulas, and you definitely need a process for that. Is the dashboard responsible for data quality? No, it only pulls the data out. Even so, every error shows up there. Lequin describes this from early AI attempts: the queries ran without an error message, but the figures were wrong, and that is much worse.1 In the Trend Monitor 2026 from the analyst firm BARC, with 1,579 respondents, data quality is in first place.6
One definition per key figure
If the AI writes its own query for every chart, the definition of “active customer” sits in each dashboard separately. Two people then build two dashboards that contradict each other.4 BI tools solve this with a shared data model; with a DIY build you need a solution of your own for it. At Lequin's, a tool called dbt, which was already in use, took care of that.1
The core KPIs and the story behind them
Which figures and which charts do you need in the first place? That is the first thing you have to understand, whether with bought dashboard software or a DIY build. According to BARC and Eckerson Group, on average only a quarter of employees actively use BI tools, and that has barely changed in seven years.7 A new tool alone does not solve that.
A team that can do it
Lequin already had data engineers, and who is allowed to see what had long been settled in the database. He writes himself: if you first have to hire a team for this, the sums look different.1
What BI tools cost: Power BI and Looker
Power BI Pro costs €12.10 per user per month at Microsoft plus VAT, with annual billing. The Premium per-user licence is €20.80. You can build reports with the free account, but to share them you need Pro or Premium.8 Power BI Pro is already included in Microsoft 365 E5.9 In that case a DIY build has to compete with a tool the company already pays for.
Looker plays in a different league. If you pay around $150,000 a year, doing the sums is more worthwhile. Lequin says his company bought four things with Looker: an interface for charts, permissions, a data model and hosting. The permissions were already in his database, the data model in dbt. Claude now draws the charts, and the ongoing running costs on AWS are now around $500 a month.1 What is left, according to Lequin, is a bill for $150,000.
When DIY is worth it instead of dashboard software, and when it is not
I would say that for large teams that need software proven over many years, high reliability and a certain level of security, dashboard software is not obsolete. For everyone else, it is worth looking at what they are actually paying the licence for.
- Data is already clean and in one central place
- Permissions are managed in the database
- Views for a few people or one question
- The licence is expensive and grows with every user
- Someone looks after security on a permanent basis
- Many teams read the same key figure
- Mandatory reports that must be verifiable
- Power BI is already paid for through Microsoft 365
- No data team in house
Before you build: Write down which five figures your team really needs every week. Often one page is enough for that, not a whole BI tool.
For the bigger picture, that is, whether software subscriptions in general are being replaced by DIY builds, see the article SaaSpocalypse: Is SaaS dead?
Conclusion: dashboard software stays, but the interface gets cheap
Building a dashboard with AI now costs almost nothing in tokens. That hits dashboard software exactly where many people pay the licence. But David Lequin's case also shows that his team saved money because data, key figures and permissions were already in place. If you have that, you can build the interface yourself, with APIs and without AI agents in the dashboard. If you are starting from zero, a BI tool mainly buys you reliability and security. Would you replace your BI tool if a DIY build could do it?
Frequently asked questions about dashboard software
What is dashboard software?
Dashboard software is a program you use to show key figures as charts on one page, connect them to data sources and share them with your team. Well-known examples are Power BI, Tableau, Looker and the free Looker Studio.
What are BI tools?
BI stands for business intelligence. BI tools collect data from different sources, prepare it and show it in reports and dashboards. The best known are Microsoft's Power BI, Salesforce's Tableau and Google's Looker.
Will AI make dashboard software obsolete?
No, but its role is changing. AI can build individual dashboards in minutes. It does not replace a unified data model, checked data and permissions management. That is exactly what BI tools continue to provide.
Can I build a dashboard myself?
Yes. A simple dashboard consists of a database, a program that outputs the figures via an API, and an HTML page that draws charts from them. An AI such as Claude or ChatGPT writes the code for you. What matters is clean data and clear key figures.
Do I need AI agents for my own dashboard?
No. A database, an API and a web page are enough for a dashboard. The AI helps with writing the code; no agent has to run in the finished dashboard.
How much does Power BI cost?
Power BI Pro costs €12.10 per user per month plus VAT at Microsoft with annual billing, and the Premium per-user licence costs €20.80. With the free account you can create reports, but to share them you need Pro or Premium. Pro is included in Microsoft 365 E5.
What is the difference between Looker and Looker Studio?
Looker Studio is Google's free reporting tool, often used for Google Analytics and Google Ads. Looker is the paid enterprise platform with its own data model, which according to the procurement service Vendr costs around $150,000 a year on average.
When is your own dashboard worth it instead of a BI tool?
When your data is already clean and in one central place, permissions are managed in the database and someone looks after security on a permanent basis. With many teams, mandatory reports or no data team of your own, a BI tool is usually the better choice.
Sources
- Lequin, D. (2026): Can we replace a $150k Looker with a bucket of HTML files? 14 October 2026. david.lequin.dev
- Microsoft Learn: Erstellen von Berichten mit Copilot in Power BI. learn.microsoft.com
- Gartner (2025): Gartner Predicts 75% of Analytics Content to Use GenAI for Enhanced Contextual Intelligence by 2027. Press release, 18 June 2025. gartner.com
- Kozachenko, K. (2026): Can Claude Dashboards Replace Your BI Tool? Bruin, 12 October 2026 (a data platform vendor). getbruin.com
- Tyler, S. (2026): Building a Tableau Quality Dashboard in MotherDuck with Claude AI. 27 March 2026. substack.com
- BARC: Data, BI and Analytics Trend Monitor 2026, 1,579 respondents. barc.com
- Hazel: Why dashboards don’t get used (a vendor of an analytics tool, citing BARC with Eckerson Group, 214 companies). fromhazel.ai
- Microsoft: Power BI – Preise. microsoft.com
- ERP Today: Microsoft to raise prices of Power BI licenses in 2025. erp.today
Where a source comes from a vendor with a vested interest, this is noted alongside it. All details checked against the original, retrieved on 30 October 2026.
Simon Gütter is a marketing expert and has worked for years at the interface of marketing, sales and automation. He finds the places where companies lose time and customers, and builds processes that run on their own: from appointment booking to reporting. More about Simon